A financially volatile business environment puts a lot of strain on companies. Double that with retailers and others operating a network of locations.
With fluctuating demand and varying performance of stores, the only constant is fixed costs. That coupled with internal pressure to “handle it.”
We get you.
A lot of clients have recently been telling they find it challenging to analyze the performance of individual stores and trace the root causes of performance issues.
To share some of the most frequent questions and – especially – ways of discovering actual performance issues we set up a discussion with Houston’s Head of Retail Analytics Tommi Havukainen.

Analysis of current network performance
Petteri, let’s dive into business. Can you share with us the most common questions you get from retailers and other businesses operating a network?
Recently the trend has been bi-polar. Some are trying to enhance the performance of existing stores to combat the tough times while others are going straight to cutting down their store network as a cost-saving measure.
Both cases share some pain points – or challenges if you will – but there are differences.
Why don’t we go through the pains of cutting down the network first? What are the biggest concerns or questions in those cases?
Over the years when the network has been grown it hasn’t necessarily been an outcome of thorough analysis and planning. Or in other words, not the result of data-driven decisions.
You might think you know each store’s catchment area, you’re certain your store attracts the target shopper demographic, you know from the sales numbers that your categories are performing as planned. And it’s the same in all stores in your network.
When it comes time to take the hacksaw and close locations it dawns on you that what if you’ve missed something all along. What if we close the wrong stores and it jeopardizes the sales and customer service so that the good intentions of saving the business hurts it in the end.
So once the plan of closing branches has been made the first questions that arise are:
1 - Will the customers move to our other stores and;
2 - What is the minimum network density to maintain the level of customer service?
How do you go about finding the right locations to close?
For companies other than retailers it’s a bit easier.
What your aim should be is to discover the overlap in catchment areas that you can leverage. That coupled with the knowledge of the serviceable available market and potential therein you can identify the feasible closings.
In retail, it’s a bit trickier. Category management plays a huge role in the local demographics and thus to an individual store’s performance.
That’s when you typically fall short in your KPI’s. Budget versus actual sales does not reveal the reasons behind success or failure. Instead of the budget – total sales or on category level – what you really should focus on is the forecasted sales potential within the catchment area.
When you have that on a category level you can identify under- and over-performers by category and then from bottom-up construct a total sales potential on a store level.
This type of performance analysis guides the drivers giving you actionable insights to base your decisions on.
What about improving the performance of existing store network – what are the key questions?
That’s simple: How can we evaluate our current networks’ point of performance and rank the points of sales in order of performance?
It’s easy to look at the costs side. Spreadsheets tell the story – personnel costs, rents, and so on.
Then you have your budgeted sales and actual sales and you’re comparing whether you hit the goals or not. That’s your default baseline. Your compass. But how well is that guiding you?
Typically there are no forecasts on sales potential. What it leads to is unrealistic expectations making the management of stores difficult.
How can you evaluate the current store networks’ performance?
Let me tell you a real-world example. A client had four stores in four towns close to each other. Similar concepts and category structures on each.
What they previously did was they increased the budgeted sales year-over-year by 10% on every store. That was a flat 10% increase in all categories.
Then they started to miss the sales targets in three out of four stores. Something needed to be done.
They did discover that the food category was driving most of the sales in one store and they thought that’s the solution – just emphasize food in all stores and be done with it.
But they had some doubts.
With Store Network Optimizer’s current network analysis – leveraging local demographics by catchment area, historical sales, and forecasted sales potential on a category level – they understood why the food category was dominating the revenues while all other categories were just there taking up shelf space.
It was the local demographics and lack of substantial competition in that store’s catchment area that made up of the high sales potential in the food category.
With forecasted sales potential by category, they had the insights to reallocate the category space overemphasizing food in that store which increased sales even more.
The story with the other three stores was different. Different demographics, different competitive landscape – leading to completely different sales potential by category.
Again, they had the insights to adjust category allocation according to forecasted sales potential and improve stores’ performance.
Had they followed their initial plan of replicating the success of one store to others – it would’ve been devastating.
So how do you rank the points of sales by performance?
Once you have the forecasted sales potential by category and by store – and comparing that to actual sales you can represent the performance as an index. That index easily indicates over- and under-performers.
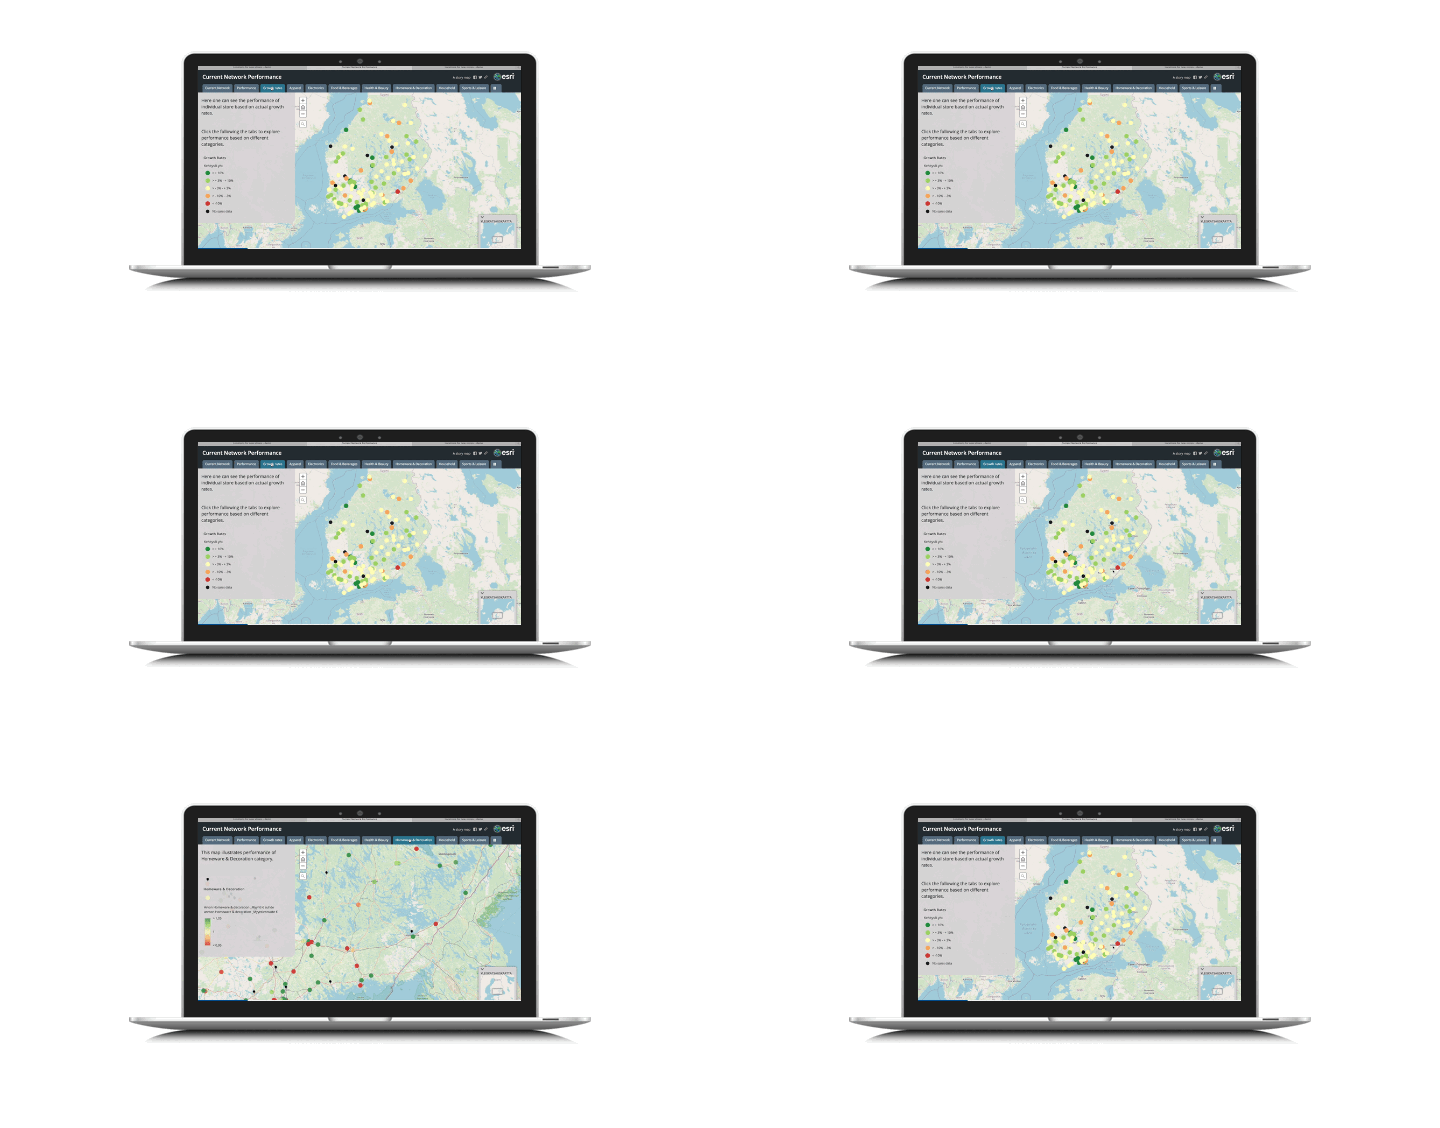
Having all the stores listed on a map interface gives you a glance at entire networks’ performance. You can then drill down into individual stores of interest, typically ones that are not performing well, to check the category performance levels. Again indexed, providing actionable insights to guide your decisions.
So instead of having one-off analysis made, when you have this type of an analytics tool continuously providing insights you can adjust the category allocation all the time to manage individual stores.
Since we’re talking about analytics and data, what data do you need in order to accomplish this?
Basically data that every retailer is either generating already or then external data that can be acquired. Local demographics (population, purchasing power, household sizes), own existing network data (location, sizes, sales), own network details (POS data, SKU data, category data), and competitor presence. That’s basically it.
Naturally, there’s an endless list of potential data sources that could be used to enrich the data model but it’s not necessary.
Thank you, Tommi, for an interesting chat.


